How to Read and Analyze KIBOR Charts in Pakistan
Financial analysts, corporate treasurers, and consumer borrowers look at KIBOR charts for different reasons. Understanding how to interpret the graphical movements of the Karachi Interbank Offered Rate gives you an unfair advantage when negotiating loans with commercial banks.
The Shape of the Yield Curve
The Yield Curve plots KIBOR rates across tenors (1-Week up to 1-Year). A normal upward curve indicates a healthy market where lenders expect higher compensation for longer-term commitments. An inverted curve signals economic distress or aggressive upcoming rate cuts.
Bid vs. Offer Spread Dynamics
In Pakistan's interbank market, the standard gap between Bid (what banks pay) and Offer (what banks charge) is strictly 50 basis points (0.50%) for standard tenors. When market liquidity dries up, bid-offer spreads can widen in secondary trading.
Policy Rate Correlation
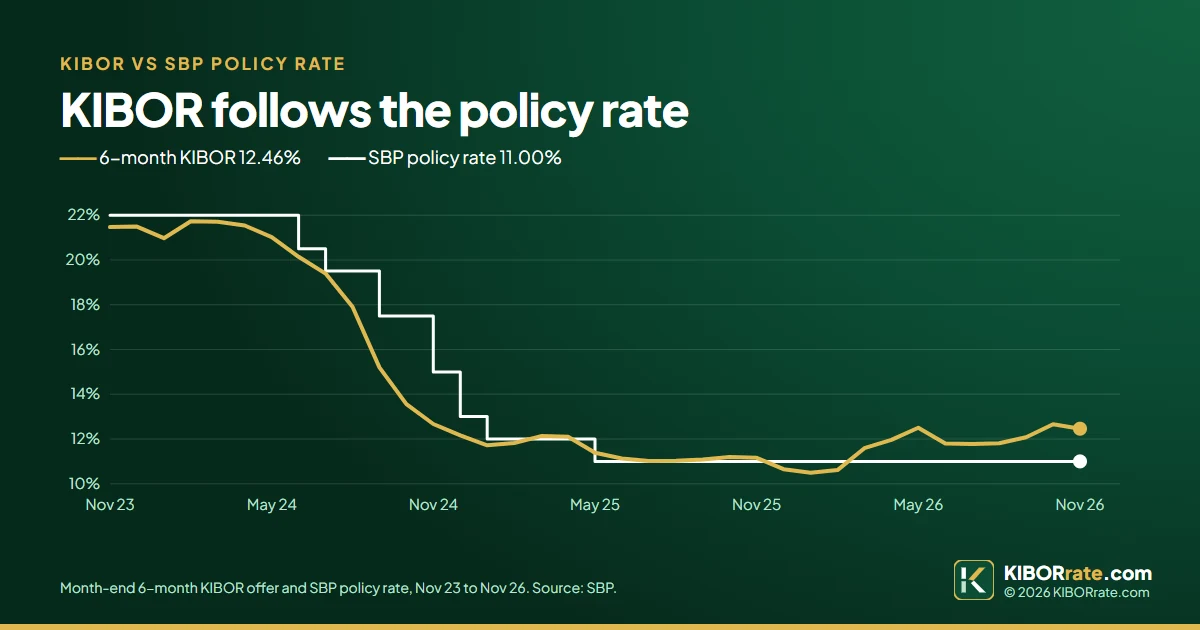
Notice how KIBOR closely hugs the State Bank of Pakistan Target Policy Rate. As shown in our multi-year chart, when SBP raised rates to 22.00% in 2023, KIBOR surged to 23.45%. As the central bank eased toward 11% to 12%, KIBOR followed in lockstep.
Why This Visual Intelligence is Essential for Loan Borrowers
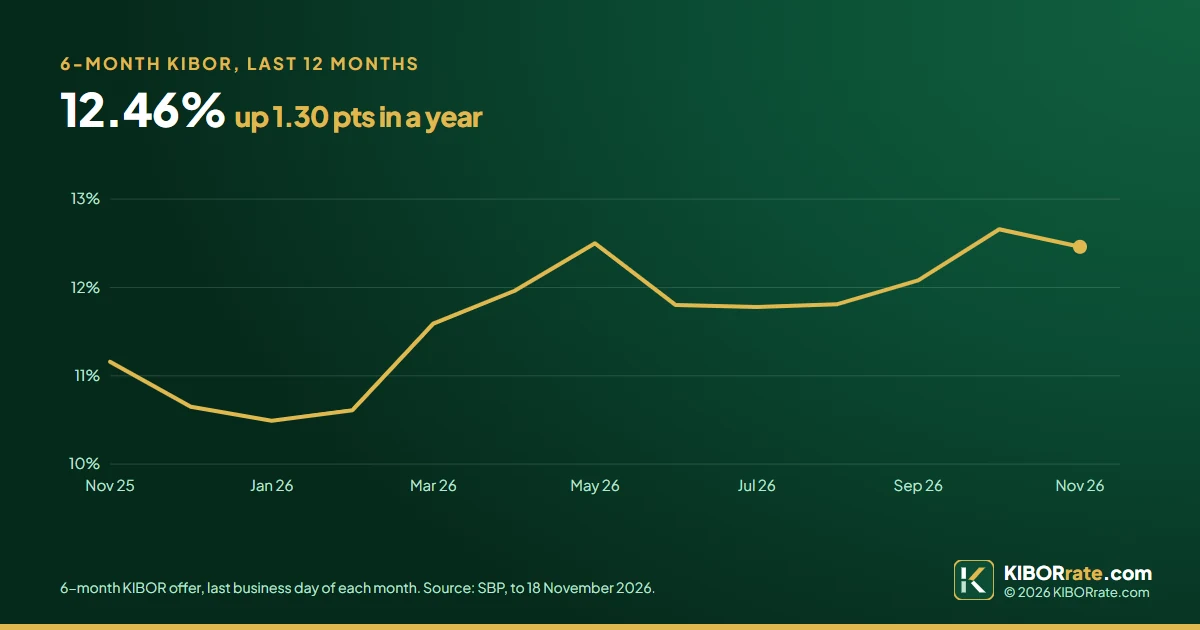
If you are planning to take a car loan or construct a home, watching the 1-Year KIBOR trendline is critical. If the trend is sloping downwards, requesting a floating-rate loan ensures your monthly installment will shrink over time. If the trend is bottoming out and turning upwards, locking in pre-payments helps protect your monthly budget from upcoming installment spikes.